
What to Look For
You will find that some days are quiet and some are busy. If you can leave the detector running for a long period of time (tens of hours) then you will start to notice a regular daily cycle which is (as you might have guessed) due to the Earth’s rotation causing the detector to go through the squashed (sunward) side and extended (night-time) side of the Earth’s magnetic field once a day. Whilst testing these detectors in York we found that these variations were large enough to spot, at around half a degree (roughly a movement of one centimetre when the spot was one metre from the bottle), which is a movement of one quarter of a degree by the magnet itself. You can see that the bottom of the dip is around midday, when the Sun is directly south, so at this point it switches from being on the east side to being in the west.
Both detectors measure the direction of the Earth’s magnetic field, but as the Northwards component is the main one the variations in the Eastward component make the most difference to the direction of the field (although these changes are still very small in all but the largest of solar storms).
On a busy day your results will be all over the place with troughs and peaks. The two following plots are of the same period of time, one is from an old SAMNET group magnetometer in York (top), and one is a scanned in version of the plot from the pop bottle detector (bottom).
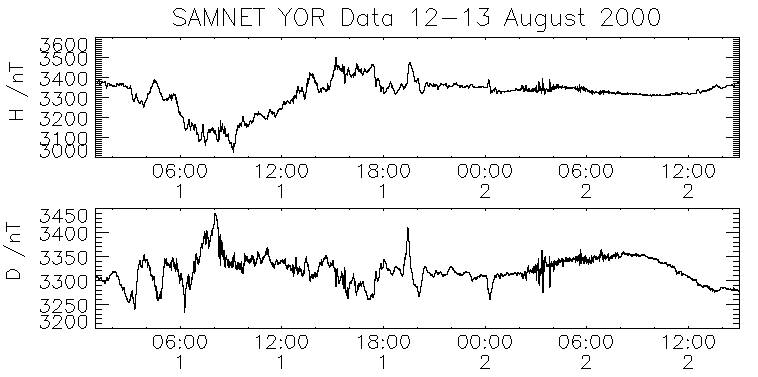
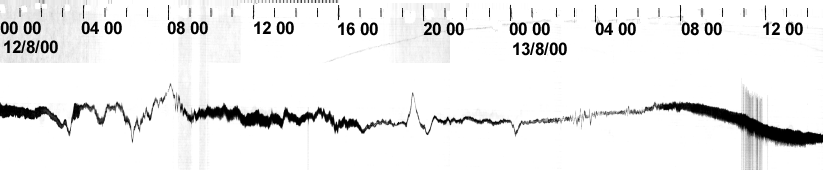
The times are in Universal Time, which is equivalent to GMT. There are several features here. Firstly it should be noted that on the bottom plot an upwards movement in the trace represents a clockwise (Northwards) movement of the magnet. The period between about 03:00 and 10:00 on the 12th is a reasonable storm, with a peak difference of 200 nT, which was caused by a Coronal Mass Ejection (CME) from the Sun. A really big storm could vary by over a 1000 nT. The big peak at 19:30 on the 12th is due to a different type of solar action, which was a big change in the speed and density of the solar wind. This type of action does not last very long. The group of small peaks and troughs at about 03:00 on the 13th are known as Ultra Low Frequency waves (ULF waves) and are caused as some space weather causes the magnetic field lines that go near the detector to vibrate like a string for a while. Finally the overall movement between around 07:00 and after on the 13th is more representative of what can be expected of a quiet day. The overall trace follows the D (Westwards) component trace from SAMNET very well, but the you should remember SAMNET measures both components, and the detector measures the angle of movement of the magnet, and this means that while the changes in D component will have the largest effect on the angle, large changes in H (northwards) may on occasion counteract the D changes a bit. This means that relative sizes are not always the same on SAMNET and the detector. This can be seen as the small peaks before the large movement at around 19:30 on the 12th, which are more prominent on the SAMNET D plot. The last thing to mention is that the broadening of the line around the daylight hours is due to the ability of our plotter to follow the light getting worse as the plotter warmed up. The 13th was a very warm day, and the plotter got so bad that it occasionally lost the light spot, as seen by the scan lines between 11:00 and 12:00.
The plot below is of results taken by the SAMNET detector (top) and our compass detector (bottom), whilst the detector was connected to a datalogger.
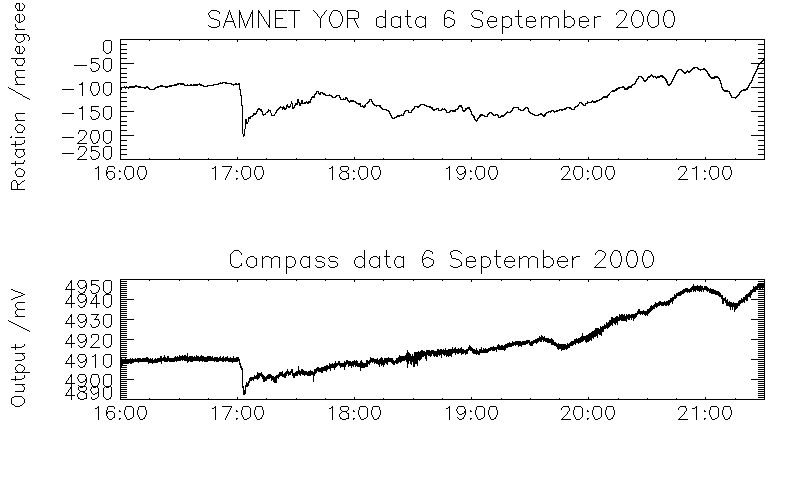
Whilst the noise is noticeably high the large signals still show through. The main things here that can be seen are the sharp drop at around 17:00, and the trough at 21:30. What is puzzling is that many of the longer period (around ten minutes) variations do not appear. Also there is a general upwards trend over the five hours for the compass detector which is not in the SAMNET plot. This is likely to be related to the temperature of the circuit, as the plot is over a time as evening falls and the air temperature drops (the detector was set up in a shed so has only a little protection from temperature changes). Hopefully if the detector can be set up in a more temperature stable environment then the results will improve. It should also be noted that while the drop at 17:00 was picked up it was also still a small event compared to those of a decent sized solar storm, so when something big happens the detector will definitely pick it up.
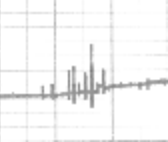
Another thing that you may pick up is lightning activity. We have found that the pulse generated by the lightning is too quick and too small for the pop bottle detector to pick up, but the compass detector can pick it up as a very small spike on the trace from a plotter. The largest line represents a change in the output of the detector of nearly 0.05 Volts. This was a large and very active thunderstorm that passed right over York, and caused some damage, later creating tornadoes in the Humber.